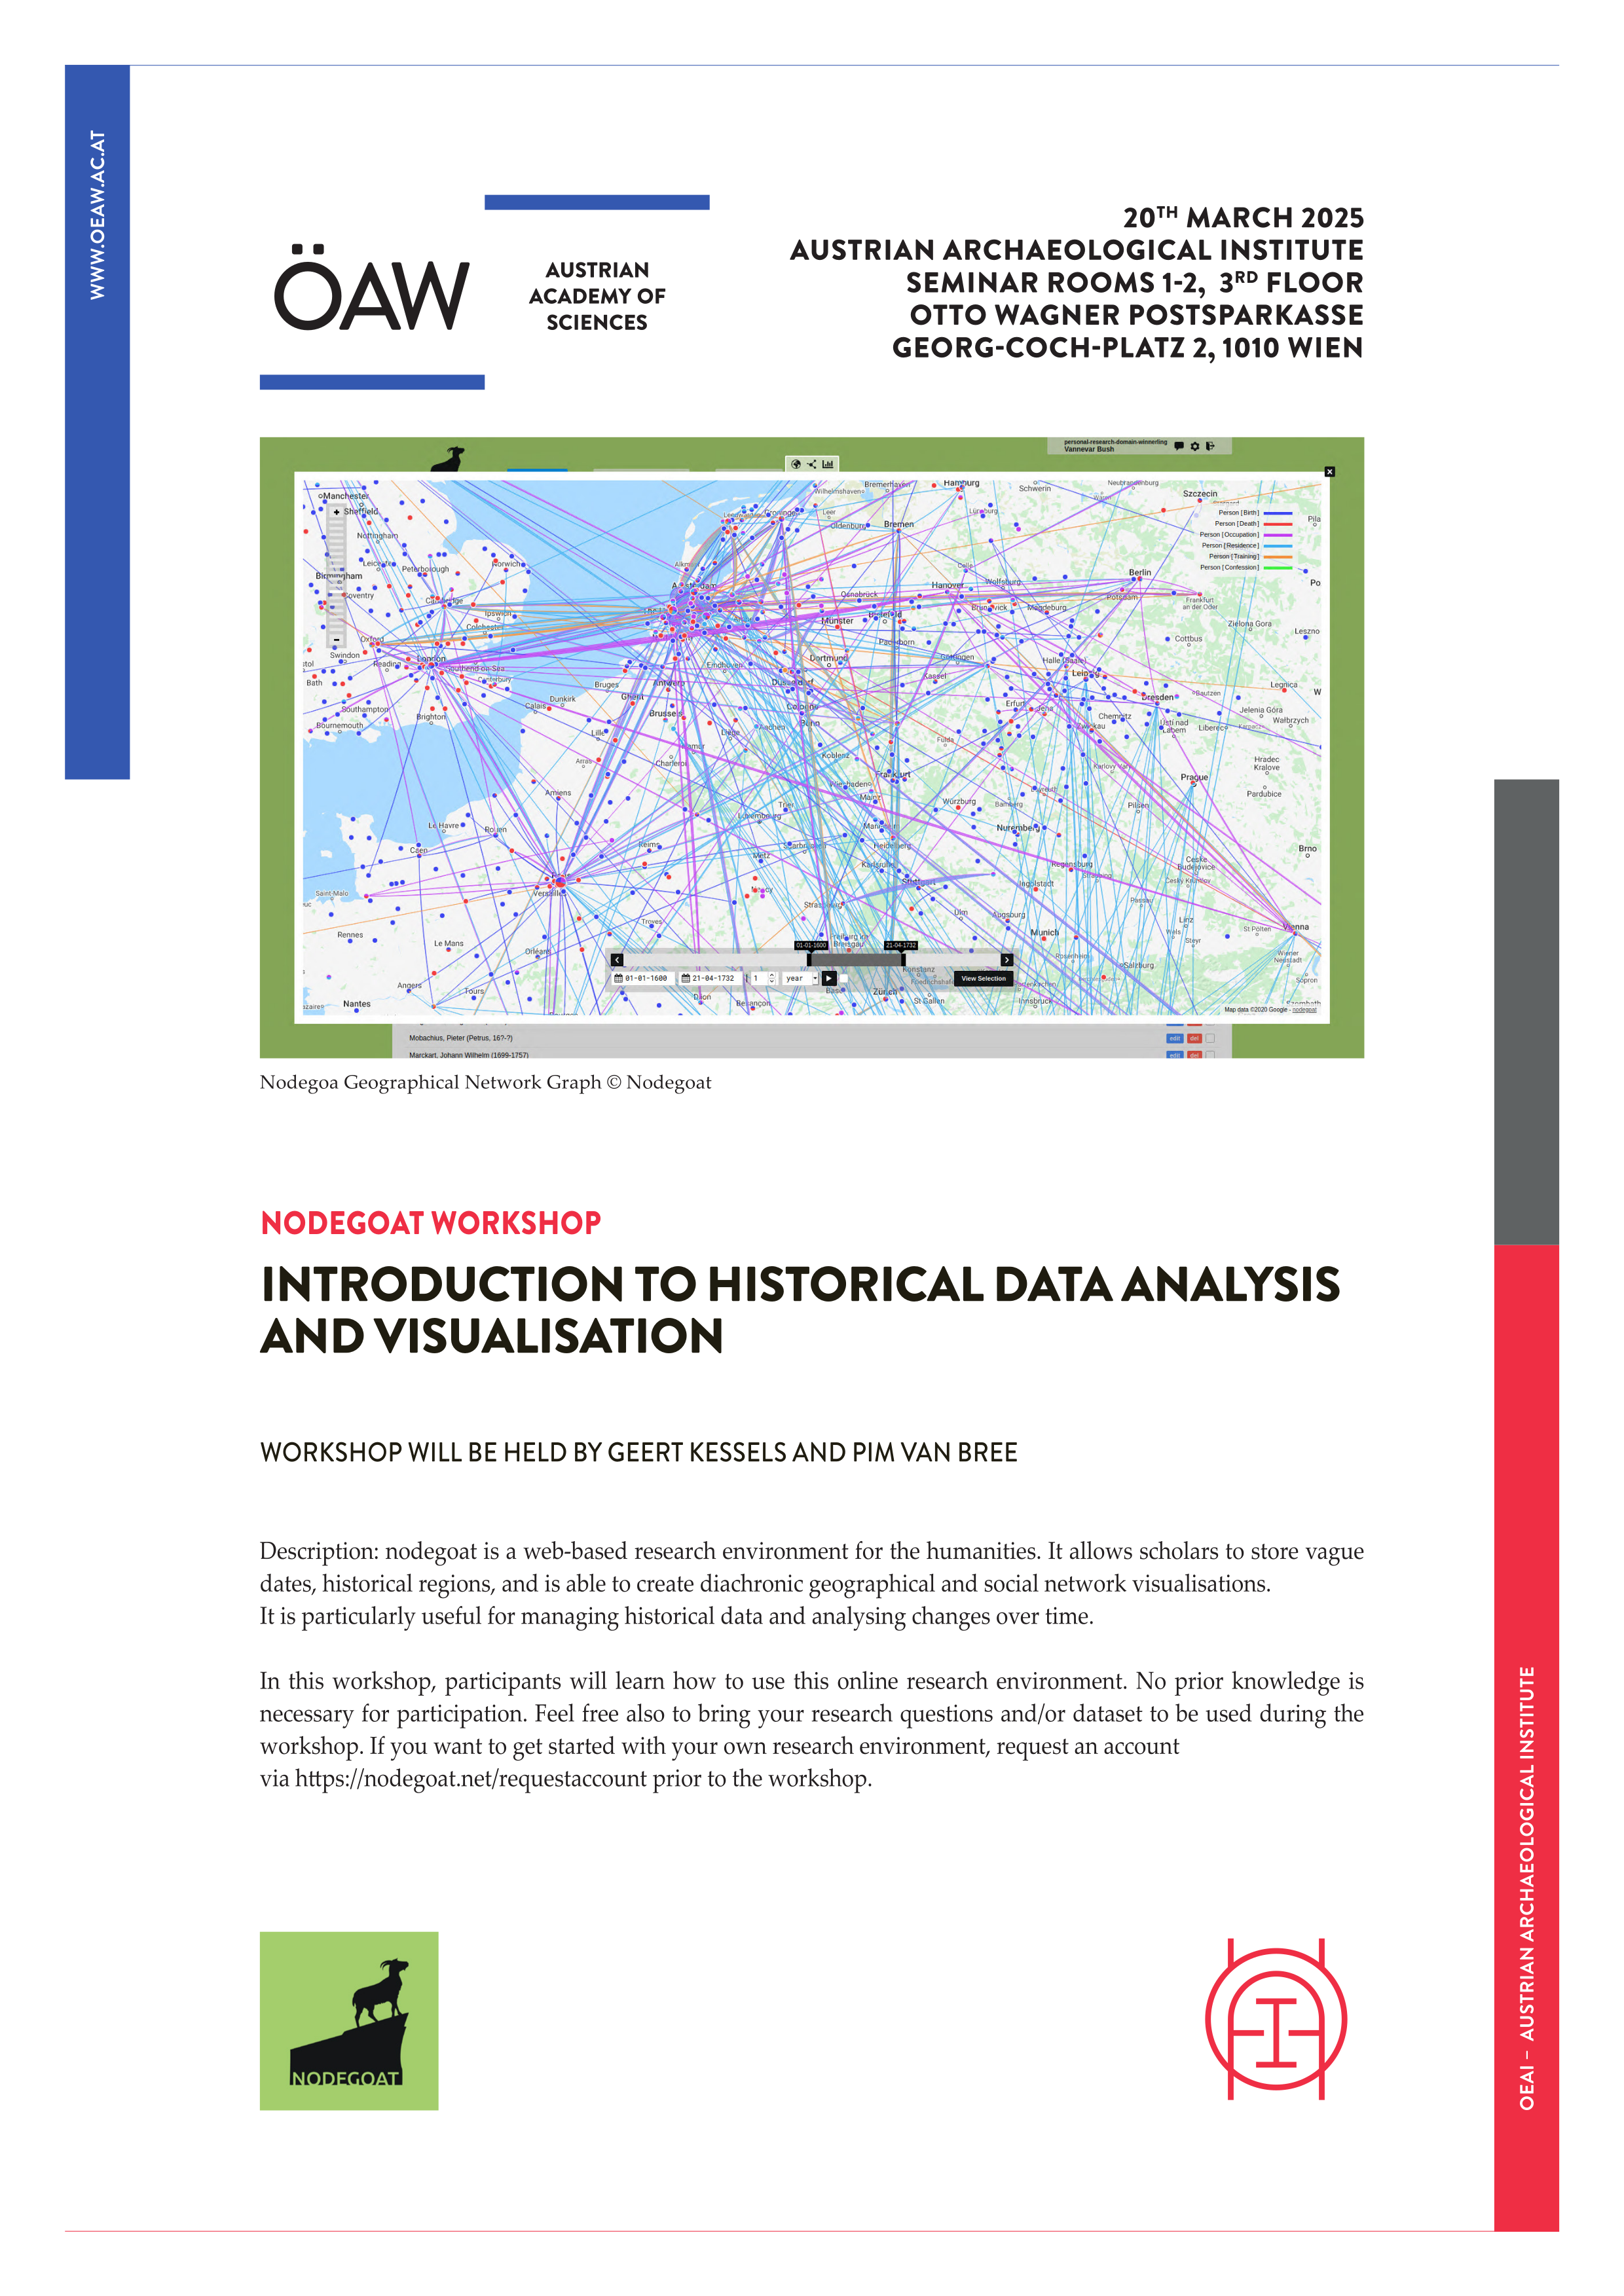
Learn how to visualise historical data on a historical map
CORE AdminThe nodegoat guides have recently been expanded with sections on working with spatial data and on visualising data on any historical map.
The best way to learn how to use nodegoat is by following the nodegoat guides: nodegoat.net/guides. New sections of this guide teach you how to store various kinds of spatial data and how to visualise your data on historical maps: 'Storing Locations', 'Create your own Gazetteer', 'Import an existing Gazetteer', 'Use a Historical Map'
You are able to use historical maps from existing collections of historical maps, like the David Rumsey Map Collection. You can also use your own images of historical maps as a background for your spatial data. In both cases you can use the Georeferencer service, which publishes map tiles.
You can find an overview of institutes that publish their maps as tiles via the Georeferencer service on this page. See this page for an overview of georeferenced maps from the David Rumsey Map Collection. To upload your own maps, go to the Georeferencer service and create an account to get started.


