LAB1100 celebrates its 10 year anniversary
CORE Admin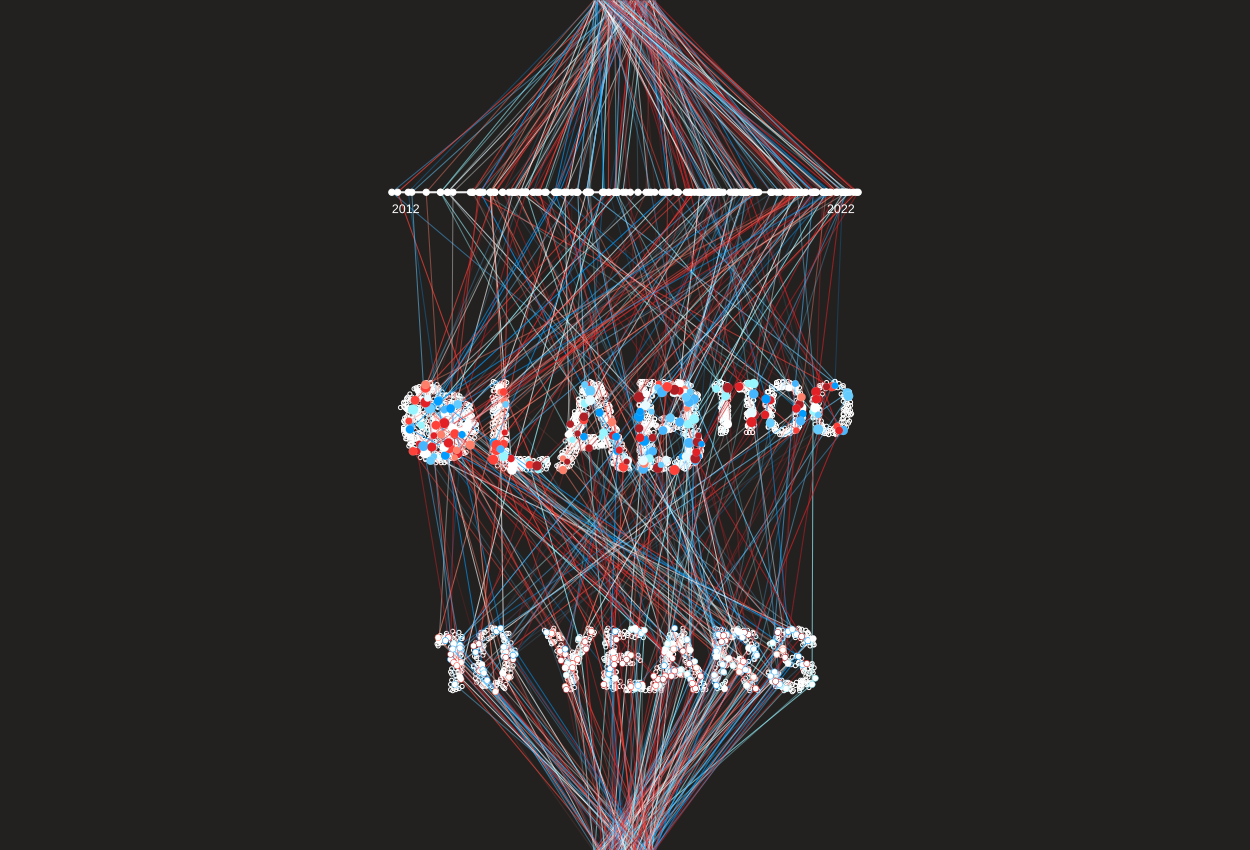
This year we celebrate our 10 year anniversary as LAB1100. We are grateful for all the exciting projects that we have been involved in, and for being able to collaborate with so many inspiring people. We look forward to continuing to work together with scholars from all over the world to deliver trailblazing research software.[....]